Published by
Last week we spoke about Identifying the work that actually needs to be done. Inevitably during a Service Design Workshop clarifying questions will be asked. How have similar efforts worked for us in the past? How often are people clicking that button? Do they start a process and stop? Where do they stop? Why do they stop?
Anyone that recently got their PMP certification will tell you that the last phase in a project is closure in which a retrospective is run to assess the success of the project against the stated goals and generate lessons learned to do better in the future. Ask any grizzled veteran project manager in healthcare how often they’ve done that in practice, and you’ll get an answer somewhere between “never” and “we did that once, but no one ever really did anything with it.”
All too often folks in our industry have started putting out the next fire before the first one is completely out so the metric for success becomes “can I safely put attention on a more pressing issue?” It’s a subjective metric that results in a stream of unending, ever-growing tasks. It’s the opposite of doing less. If we’re going to learn to do less with our less, we’ll have to exert some of our effort getting serious about metrics. What is success? How do we measure success?
If you have product managers in your organization, you can probably feel them nodding in agreement and feeling seen. A good product manager will ensure you answer all these questions, continue tracking progress to these metrics, and course correct when invariably activities unrelated to your definition of success come up. If you have product managers, now’s the time to start taking them seriously. If you don’t have product managers, invest in them. Their function is fundamental to survival in our new reality.
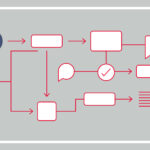
Even if you have the best product managers in the world, metrics are only as good or as available as the data behind them. EHRs may dominate the healthcare technology landscape, but they present two major challenges: they don’t have all your data, and their tools are, at best, kludgy. The problems we need to address require data from EHRs, Claims, Websites, Mobile Apps, Surveys, Testimonials, CRMs, ERPs, etc. To answer the questions we talked about last week and track progress towards goals we must get serious about analytics.
Implementing useful analytics across all these systems is no small task. Don’t be afraid to ask for help. While every organization’s journey will be different, there are some fundamental steps you can take to increase your chances of an effective outcome:
- Define North Star(s) and support metrics early: technology should always be in support of the organization’s goals
- Start with a unified measurement framework: create a cross-platform analytics taxonomy (events, properties, user IDs) that support consistent measurement across all user journeys
- Use a modern product analytics tool: There are great companies like Amplitude, Mixpanel, and Posthog out there that can provide cross-platform tracking and robust insight tools
- Prioritize event quality over quantity: Not all events are created equal so concentrate your efforts on those in service of your north star(s)
- Build analytics into launch and experimentation process
This last point is worth calling out. One lesson we should absolutely have learned by now but tend to forget is that analytics, like everything else ever implemented, are not just something you turn on and forget. Getting useful insights requires time, money, and more importantly concentrated, sustained effort. Its proper use requires both a thoughtful implementation and change in mindset to include analytics as a foundational piece of all development going forward. Analytics needs to become one or more team member’s primary responsibility. Only through regular reviews and maintenance can the highest data integrity be ensured.
How does all this work help? Let’s take our Bill Pay button placement example from last week. As you may recall the request was to move the Bill Pay button to the top of the patient portal experience to speed up revenue. This brought many questions, some which could be answered if good analytics were in place. A good system could tell you how many of your customers are regularly using the portal at all. If that’s low, it doesn’t matter where the Bill Pay button is located.
It can also tell you how many of your users have selected the Bill Pay button from its current location and more importantly what they did after that. Maybe they hit the button, then looked at the details of their bill and backed out. That’s a good indication that people aren’t understanding their bill. Maybe they hit the button, then go to select a payment method and back out. That could be a good indication that you’re not offering payment methods modern patients prefer. Maybe they hit the button, see that they don’t have a balance, and back out. That’s a good indication displaying the balance in a previous screen might drive engagement. In all those instances we can use analytics to see not only what people are doing, but perhaps more importantly where they are abandoning a process. That’s where you want to target your interventions. Then when you make your change, you can follow through and see if the desired behavior has changed. Continuous monitoring and iteration is the key to achieving your goals.
Once you’ve identified the problems to solve and used your analytics to determine likely effective solutions you will have a list so long that you can’t possibly tackle it all at once. Next week: Prioritizing
If you’re interested in making these ideas a reality we can help. Contact us here and we can get started understanding where you are, where you want to go, and how we can help you specifically.